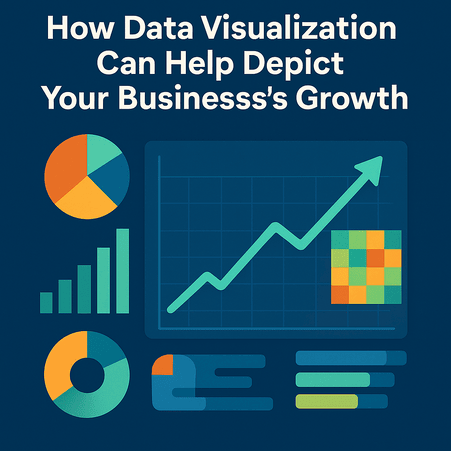
Business owners use data to make meaningful decisions in business. But data that is one-dimensional and is only in one format can, understandably, get a bit monotonous, not to mention tedious to go through. This is where data visualization transforms the unrelatable text into visually appealing graphics that you can use to help depict your business’s growth. Here’s how:
Benefits of data visualization
As you can imagine, having data in visual formats that are easier to understand and interpret, such as graphs, charts, plots, and more, can help business owners in the decision-making process by making the whole process much quicker and more efficient. Other benefits include:
Helps to identify emerging trends and patterns in the market
From a marketing perspective, graphs, infographics, and such can help paint a much clearer picture concerning emerging trends and patterns in the market. Therefore, this can assist the marketing team in creating a more tailored marketing strategy where the team will have access to meaningful data that is easily identifiable and can be interpreted more easily. Furthermore, speed of decision-making couldn’t be more critical than in the digital arena, especially where there seems to be a perpetual race to outdo your competition.
As much as data visualization assists you with your marketing strategy regarding tailoring your marketing message to your audience much better, it can also help with enhancing the marketability of your company to investors if, say, you were looking for a large injection of startup capital to get your business off the ground. Furthermore, an investor’s time is valuable, so the quicker you communicate your message, the quicker it should be to reach a decision, especially if the proposal is presented as simplistically and elegantly as possible.
Speaking of tools that you can use to make your presentations or reports easier to interpret, there are many ways to go about this and could include:
Histograms
Information is represented on a graph with bars representing data that fall within specific predetermined ranges to provide a meaningful set of results.
Heat maps
Heat maps use various box colors in a chart format to identify numerical data quickly.
Charts

Charts are one of the most popular types of data visualization techniques that many companies use to illustrate a point. Line charts, bar charts, and scatter charts are some of the most common variations of charts that you will often come across.
Infographics
Infographics are also an excellent way to visually depict data, especially if you can add them to your website. Apart from the graphics being eye-catching, it can also help increase your website’s user-friendliness, especially if the infographic is easy to read and scan through. Suppose you need help creating an easy-to-understand infographic. In that case, it’s easy to create an infographic using a free template that is available online that you can customize as you wish by adding in your own design elements, text, background colors, etc.
Indeed, data visualization is the way to go if your company deals with large quantities of data that could do with a bit of manipulation to become as user-friendly as possible.
If you are looking for digital marketing assistance to showcase what your business does best, explore The Jolly Kraken for expert information and find out how we can help you create eye-catching visuals that will grab your audience’s attention.


Leave a Reply